
This graphic was created and used as a green screen backdrop for Honest Reporting's video productions. I designed this map to represent a digital grid of communication.
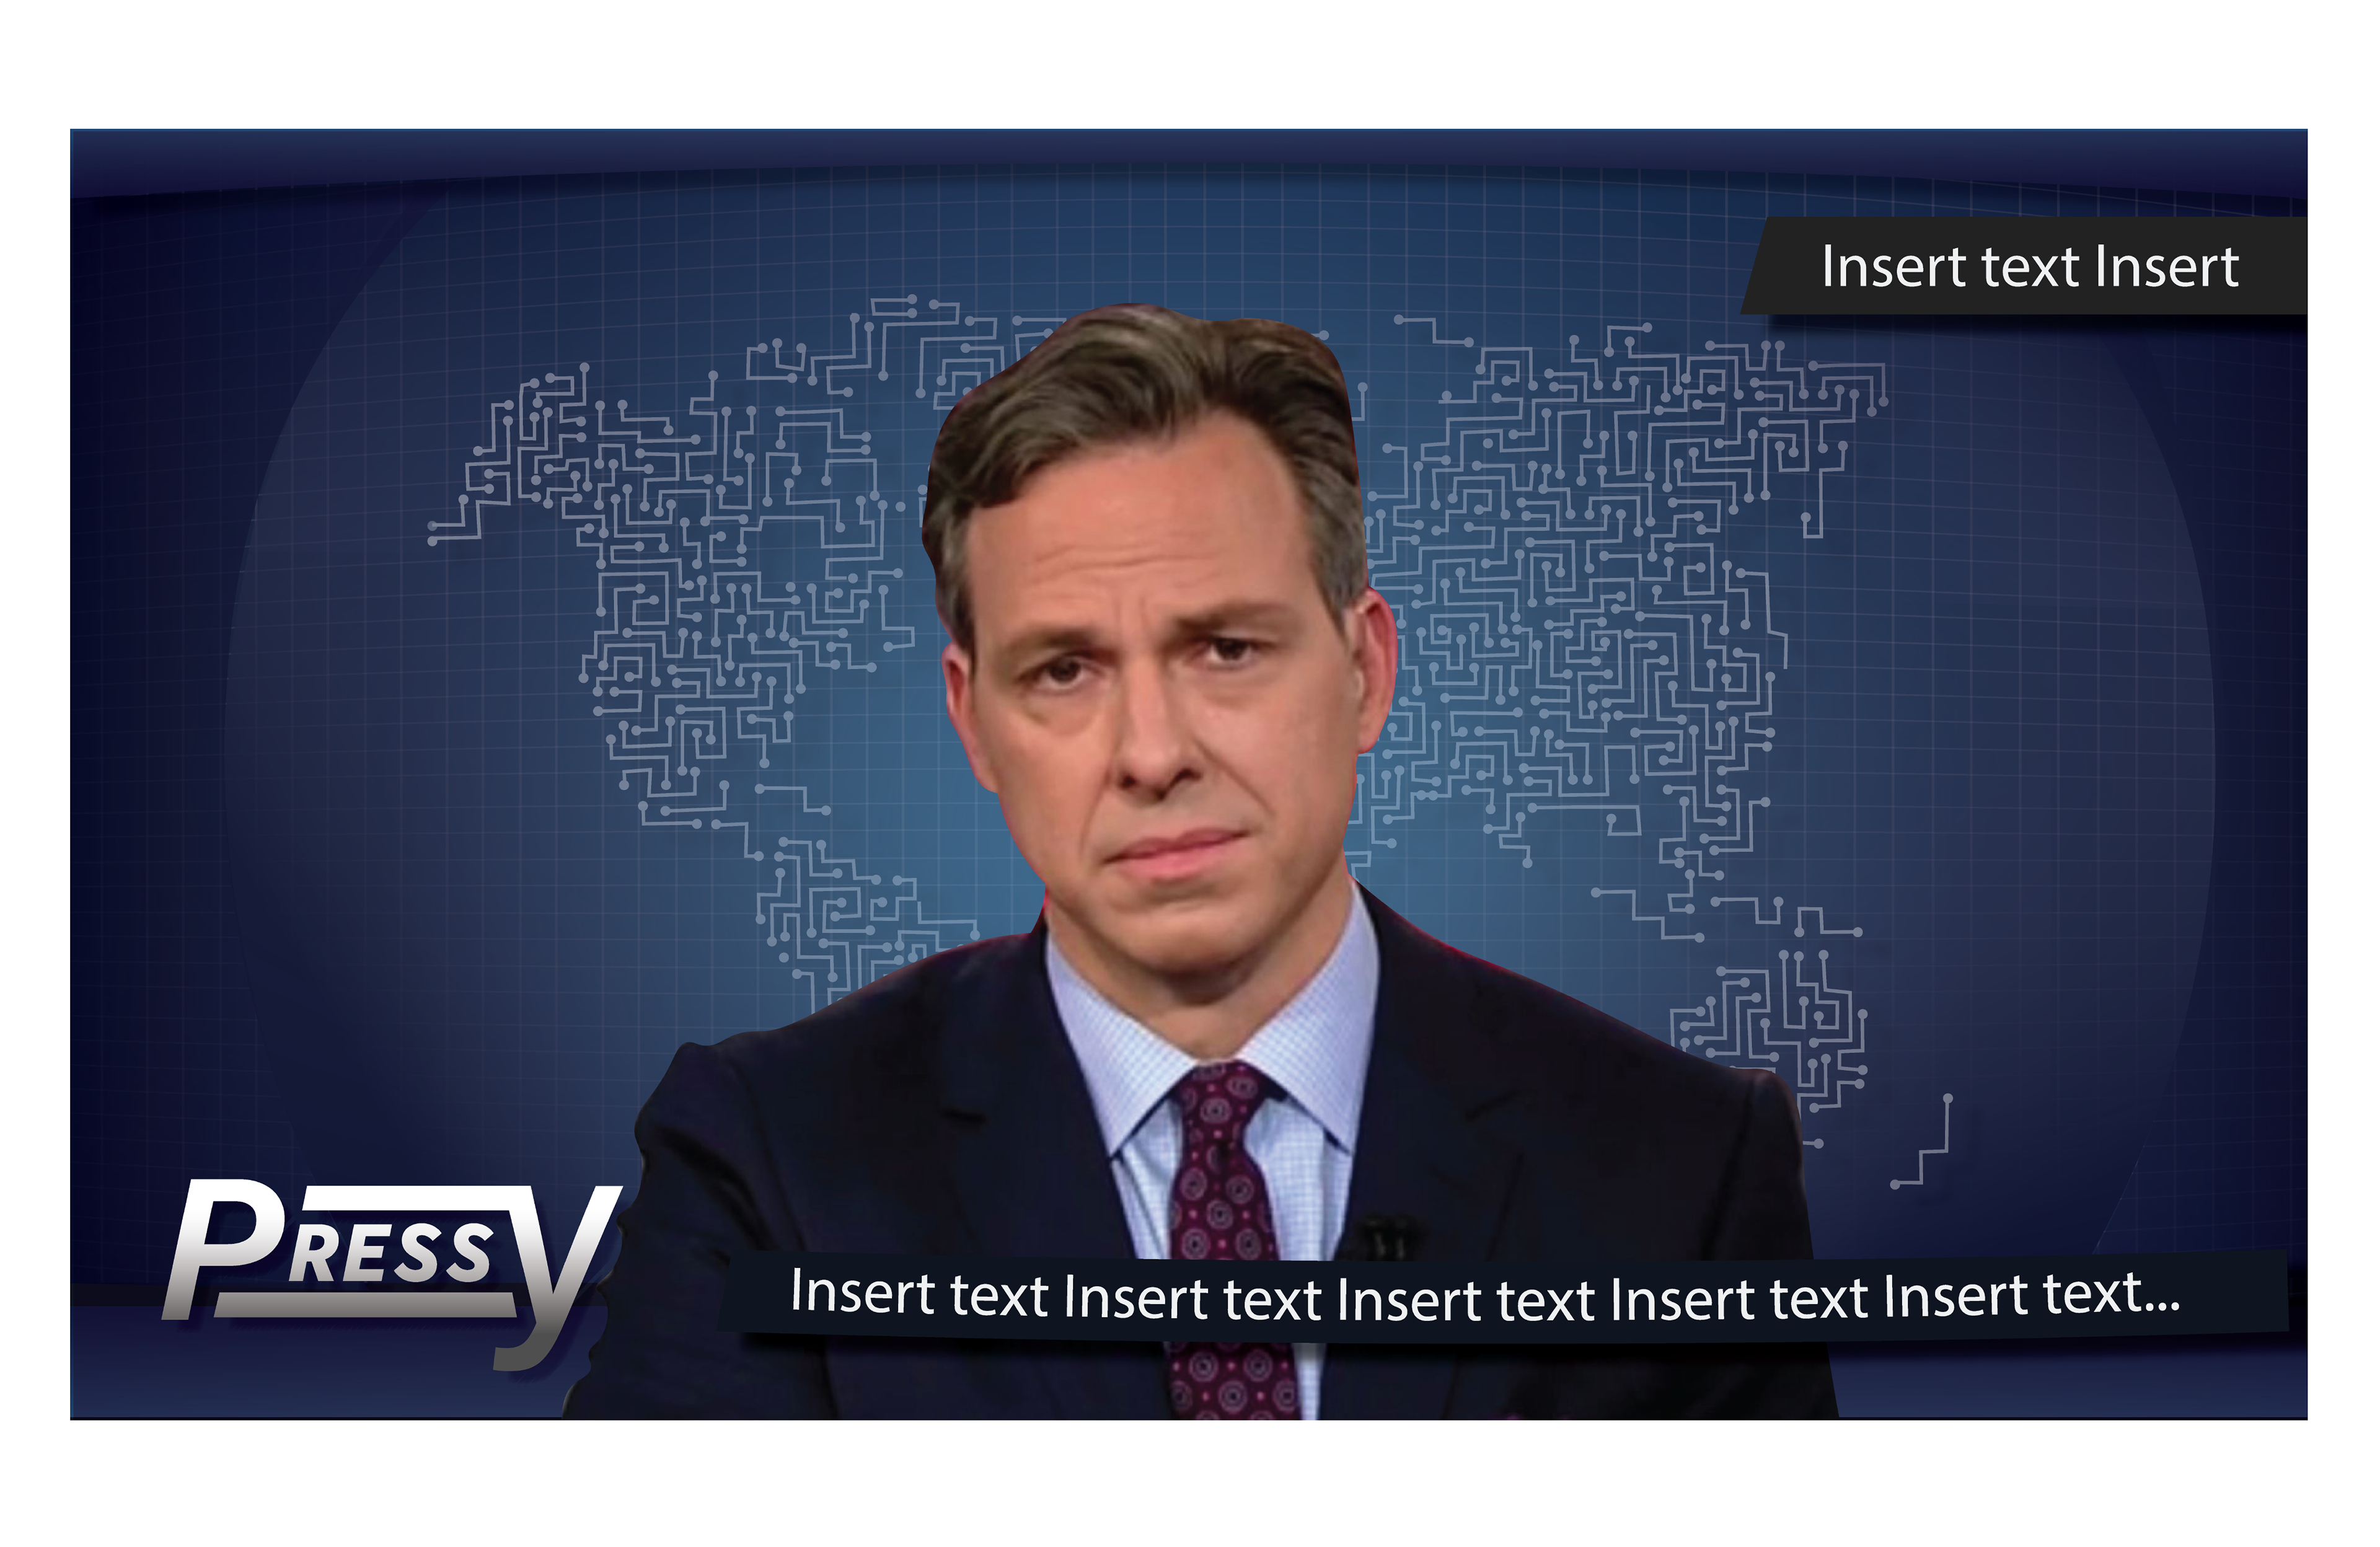
In the image above, I inserted a photo of Jake Tapper to show how my digital grid would appear on screen.
The remaining graphics I created for "Honest Reporting" were utilized as thumbnails. The magnifying glass symbolizes Honest Reporting's mission to fact-check various publications.